-
Looking for HSC notes and resources? Check out our Notes & Resources page
Make a Difference – Donate to Bored of Studies!
Students helping students, join us in improving Bored of Studies by donating and supporting future students!

BoS trials Maths and Chemistry 2020 (3 Viewers)
- Thread starter Trebla
- Start date
MrGresh
Active Member
Imagine creating a chem trial so long my stapler couldnt staple the whole thing haha
And wow this trial is making me feel dumb
And wow this trial is making me feel dumb
Why so. Remember BOS exams are generally designed to be harder than previous HSC exams. They’re good practise because they prepare you for tougher questions, so don’t be disheartened.Imagine creating a chem trial so long my stapler couldnt staple the whole thing haha
And wow this trial is making me feel dumb
MrGresh
Active Member
Yeah, I know. It's just I keep making dumb mistakes. I know most of my stuff but once i get past 1 past paper in a day i make stupid errorsWhy so. Remember BOS exams are generally designed to be harder than previous HSC exams. They’re good practise because they prepare you for tougher questions, so don’t be disheartened.
like this morning i did 2019 hsc first and got 91, but now I'm doing BOS and I'll probably get low 80s
Ye I mean that's normal. Idk about Chem, but the top mark for 4u was 72. That's ridiculously low for the amount of hyper-intelligent people on here for a normal test, but high af for a BoS trials paper. If you read the starting comment from Trebla on this thread it's legit: "want some good practice for the harder questions in the HSC exams?". Also, there's an abundance of sources you can find (that i'm sure you're already aware of tbh) that help with correcting silly mistakes and techniques n shit.Yeah, I know. It's just I keep making dumb mistakes. I know most of my stuff but once i get past 1 past paper in a day i make stupid errors
like this morning i did 2019 hsc first and got 91, but now I'm doing BOS and I'll probably get low 80s
Best of luck man!
MrGresh
Active Member
Thanks!Ye I mean that's normal. Idk about Chem, but the top mark for 4u was 72. That's ridiculously low for the amount of hyper-intelligent people on here for a normal test, but high af for a BoS trials paper. If you read the starting comment from Trebla on this thread it's legit: "want some good practice for the harder questions in the HSC exams?". Also, there's an abundance of sources you can find (that i'm sure you're already aware of tbh) that help with correcting silly mistakes and techniques n shit.
Best of luck man!
Hey whoever put together this paper: in the AAS graphing question you say you cant join the graph up to (0,0). My teacher says you MUST do this and will lose marks otherwise - other past papers agree. Not sure if you want to fix it or not since its a bit ambiguous.
This is wrong to do. What your teacher is stating does not apply to this question as no data point for the 0 concentration has been provided. Can you please state what past papers as I have not seen any HSC papers stating this. Because the whole purpose of drawing a graph is to draw a trend. We can only draw this trend inside the data points we have. This is because how do you know the same trend exists outside the range of data points you obtained? The answer to that is we don't know and therefore it is incorrect to assume a trend continuesThanks!
Hey whoever put together this paper: in the AAS graphing question you say you cant join the graph up to (0,0). My teacher says you MUST do this and will lose marks otherwise - other past papers agree. Not sure if you want to fix it or not since its a bit ambiguous.
- Joined
- Feb 16, 2005
- Messages
- 8,668
- Gender
- Male
- HSC
- 2006
Along with the whole issue of extrapolation as jazz519 mentioned above, I'm going to offer a mathematical/statistical explanation.Hey whoever put together this paper: in the AAS graphing question you say you cant join the graph up to (0,0). My teacher says you MUST do this and will lose marks otherwise - other past papers agree. Not sure if you want to fix it or not since its a bit ambiguous.
What you're effectively doing is plotting a regression line (albeit graphically rather than mathematically). When you estimate the regression line based on your data sample (either by hand or using software), you do not force the intercept to be zero, even if the theoretical equation suggests it should be zero. The reason being is that by forcing the line to go past a zero intercept, you introduce bias into the regression line (i.e. trying to force the data results to fit the model). At the end of the day the regression line that you estimate should be purely based on the empirical data, not the theoretical model.
In last year's HSC, the zero point was actually a sample data point so it kind of sidestepped around that issue.
MrGresh
Active Member
Along with the whole issue of extrapolation as jazz519 mentioned above, I'm going to offer a mathematical/statistical explanation.
What you're effectively doing is plotting a regression line (albeit graphically rather than mathematically). When you estimate the regression line based on your data sample (either by hand or using software), you do not force the intercept to be zero, even if the theoretical equation suggests it should be zero. The reason being is that by forcing the line to go past a zero intercept, you introduce bias in into the regression line (i.e. trying to force the data results to fit the model). At the end of the day the regression line that you estimate should be purely based on the empirical data, not the theoretical model.
In last year's HSC, the zero point was actually a sample data point so it kind of sidestepped around that issue.
An example I have found is the 2019 PEM chem paper.This is wrong to do. What your teacher is stating does not apply to this question as no data point for the 0 concentration has been provided. Can you please state what past papers as I have not seen any HSC papers stating this. Because the whole purpose of drawing a graph is to draw a trend. We can only draw this trend inside the data points we have. This is because how do you know the same trend exists outside the range of data points you obtained? The answer to that is we don't know and therefore it is incorrect to assume a trend continues
I understand what you're saying and I trust you, but I know for sure my teacher has explicitly said that you are to add 0,0 as a point in your graph. He's been teaching far longer than any of us have been alive haha
I might email him and see what he says, just to confirm.
By the way - thanks so much guys for writing this paper - it is very much appreciated! (but you guys are so strict with your marking schemes haha)
MrGresh
Active Member
Response from my teacher:
"
Yes, it is always okay to include (0,0) as a point on that graph.
It is reasonable to assume that there will be zero absorbance when there is zero concentration of the stuff that is absorbing the light.
Just be careful if you are provided with axes that already have numbers on them. (Make sure you know correctly identify where ‘zero,zero’ is on the scale provided).
"
I don't mean to undermine or argue with you guys, I'm sure this is one of those things which are not ok in real life but are in the HSC just to simplify things.
Thanks again!
"
Yes, it is always okay to include (0,0) as a point on that graph.
It is reasonable to assume that there will be zero absorbance when there is zero concentration of the stuff that is absorbing the light.
Just be careful if you are provided with axes that already have numbers on them. (Make sure you know correctly identify where ‘zero,zero’ is on the scale provided).
"
I don't mean to undermine or argue with you guys, I'm sure this is one of those things which are not ok in real life but are in the HSC just to simplify things.
Thanks again!
I understand what your teacher is saying but that is not a good argument or reason in my opinion to draw a (0,0) data point. What your teacher is saying is not always true as not all solutions have 0 absorbance for 0 concentration. This is because if you are analysing something that is in the form of a mixture absorbance may occur not only from the species you are analysing but other components in the mixture. If you look at any of the HSC papers they never connect to the (0,0) point unless that data point has been provided.
MrGresh
Active Member
I might be being a doofus but doesnt the anwers in your paper contradict what you just said?I understand what your teacher is saying but that is not a good argument or reason in my opinion to draw a (0,0) data point. What your teacher is saying is not always true as not all solutions have 0 absorbance for 0 concentration. This is because if you are analysing something that is in the form of a mixture absorbance may occur not only from the species you are analysing but other components in the mixture. If you look at any of the HSC papers they never connect to the (0,0) point unless that data point has been provided.
"The lamp in AAS contains the element to be analysed. In this case it contains strontium. The lamp therefore produces specific wavelengths of light that can only be absorbed by strontium ions in the sample. Therefore, other metals such as lithium do not interfere with the measurement that is obtained as they do not absorb light at these wavelengths." - Answer to Q31B
Sorry if I'm being an idiot or coming off as a twat
It will mostly absorb due to the strontium however you need to understand that in real life it is not as simple as that because there can be other sources of error that lead to it not being 0. In real life you would actually take a blank measurement and then subtract that off everything and then make that the 0 point. This would especially be a problem for other techniques that are not as selective as AAS such as UV-Vis and colorimetry.I might be being a doofus but doesnt the anwers in your paper contradict what you just said?
"The lamp in AAS contains the element to be analysed. In this case it contains strontium. The lamp therefore produces specific wavelengths of light that can only be absorbed by strontium ions in the sample. Therefore, other metals such as lithium do not interfere with the measurement that is obtained as they do not absorb light at these wavelengths." - Answer to Q31B
Sorry if I'm being an idiot or coming off as a twat
MrGresh
Active Member
Ok cool, thanks for the answers - things are never simple in real life are they hahaIt will mostly absorb due to the strontium however you need to understand that in real life it is not as simple as that because there can be other sources of error that lead to it not being 0. This would especially be a problem for other techniques that are not as selective as AAS such as UV-Vis and colorimetry.
Do you think marks would be deducted in HSC if I extrapolated to 0,0? Kinda confused if i should listen to my teacher or you folk
If you want to extrapolate do it in dotted lines insteadOk cool, thanks for the answers - things are never simple in real life are they haha
Do you think marks would be deducted in HSC if I extrapolated to 0,0? Kinda confused if i should listen to my teacher or you folk
- Joined
- Feb 16, 2005
- Messages
- 8,668
- Gender
- Male
- HSC
- 2006
I think it would be safe to assume that if you didn't extrapolate to the origin (unless the origin itself is a data point), you would not lose marks because the validity of the trend still holds (i.e. there is nothing wrong or incomplete about it). If you did lose marks, it would certainly be called out and questioned by many people.Ok cool, thanks for the answers - things are never simple in real life are they haha
Do you think marks would be deducted in HSC if I extrapolated to 0,0? Kinda confused if i should listen to my teacher or you folk
Usually if extrapolation is required, the question would make that clear (see Physics 2019 paper). However, note that extrapolation does NOT necessarily imply extrapolation to the origin, especially if the line of best fit does not align that way (this is completely independent of what the theoretical model says).
As for if you did extrapolate without being asked to in the question, that's a bit unknown as to how lenient the HSC markers would treat that. However, note that the HSC in the past has asked questions where students were asked to point out the validity issues from extrapolation (though usually for non-zero values).
MrGresh
Active Member
Alright thanks for the detailed response!I think it would be safe to assume that if you didn't extrapolate to the origin (unless the origin itself is a data point), you would not lose marks because the validity of the trend still holds (i.e. there is nothing wrong or incomplete about it). If you did lose marks, it would certainly be called out and questioned by many people.
Usually if extrapolation is required, the question would make that clear (see Physics 2019 paper). However, note that extrapolation does NOT necessarily imply extrapolation to the origin, especially if the line of best fit does not align that way (this is completely independent of what the theoretical model says).
As for if you did extrapolate without being asked to in the question, that's a bit unknown as to how lenient the HSC markers would treat that. However, note that the HSC in the past has asked questions where students were asked to point out the validity issues from extrapolation (though usually for non-zero values).
This is an interesting discussion, about which I would like to make a few points.
Though I am not generally into arguments from claimed expertise, I do want to preface this by saying:
There was also a question in this year's HSC which deals with extrapolation and interpolation, on which I suspect many students will have made mistakes by not analysing the data in the proper way.
Jazz points out some problems with this assertion (as has Trebla above):
Though I am not generally into arguments from claimed expertise, I do want to preface this by saying:
- I have a first class Honours degree with a double major in Chemistry and a minor in Mathematics
- I also have a PhD in which I studied learning, developing understanding, and assessment in Chemistry
- I have tutored HSC and University Chemistry and Mathematics for more than two decades, have lectured Chemistry at University, and published research in Science Education
Within the bounds of the data points, drawing a line / curve of best fit is carrying out an interpolation. Extending beyond the bounds of the data is extrapolating. Extrapolation should only be done with care and due consideration for the validity of assumptions / justifications / that the trend should / will continue outside the range of the data. Interpolation should not be based on any data outside what was measured, so adding a (0, 0) point because you expect the trend should include the origin is bad technique. Similarly, extrapolation should not be done based on expectations of what the result should be, but only by following the established trend from the data. So, extrapolating to check whether an A v. c graph goes through the origin (as is expected) is reasonable, but forcing it through the origin and thereby altering the interpolation through the data is not appropriate, for the reasons that Trebla stated:This is wrong to do. What your teacher is stating does not apply to this question as no data point for the 0 concentration has been provided. Can you please state what past papers as I have not seen any HSC papers stating this. Because the whole purpose of drawing a graph is to draw a trend. We can only draw this trend inside the data points we have. This is because how do you know the same trend exists outside the range of data points you obtained? The answer to that is we don't know and therefore it is incorrect to assume a trend continues
I want to add that there are situations where a considerable extrapolation is performed. One such experiment would be taking a fixed sample of gas and measuring its volume at different temperatures. The data might range over (say) 0 to 100 degrees Celsius. Plotting the V v. T (deg C) data should interpolate to a linear graph with a decent R2 value (and the equation of the regression line can be calculated fairly easily or obtained from software like Excel). Then, extrapolate all the way back to the intercept on the T axis. This corresponds to a theoretical volume of 0 and thus gives an estimate for absolute zero in degrees Celsius. I did this experiment when I was at school and the result was reasonable when considering the accuracy of measurements and the distance of the extrapolation. We were not asked to do the next step, but it is worth thinking about what the graph would look like if we could collect data for temperatures well below zero and particularly approaching absolute zero... the actual data would match the extrapolation and then cease to follow the trend - can you see why?Along with the whole issue of extrapolation as jazz519 mentioned above, I'm going to offer a mathematical/statistical explanation.
What you're effectively doing is plotting a regression line (albeit graphically rather than mathematically). When you estimate the regression line based on your data sample (either by hand or using software), you do not force the intercept to be zero, even if the theoretical equation suggests it should be zero. The reason being is that by forcing the line to go past a zero intercept, you introduce bias into the regression line (i.e. trying to force the data results to fit the model). At the end of the day the regression line that you estimate should be purely based on the empirical data, not the theoretical model.
In last year's HSC, the zero point was actually a sample data point so it kind of sidestepped around that issue.
There was also a question in this year's HSC which deals with extrapolation and interpolation, on which I suspect many students will have made mistakes by not analysing the data in the proper way.
MrGresh, I have to agree strongly with Jazz that your teacher is simply wrong on this point. It is not reasonable to assume that there will be zero absorbance when there is zero concentration. It is reasonable to expect or anticipate that there will be zero absorbance at zero concentration. It is reasonable to extrapolate from the data to check whether zero absorbance corresponds to zero concentration. It is even reasonable to posit that there is an error if they do not correspond... but it is not ever reasonable to add an expectation as a point of data to a data set and then analyse as if the expectation was an empirical measurement.Response from my teacher:
"
Yes, it is always okay to include (0,0) as a point on that graph.
It is reasonable to assume that there will be zero absorbance when there is zero concentration of the stuff that is absorbing the light.
Just be careful if you are provided with axes that already have numbers on them. (Make sure you know correctly identify where ‘zero,zero’ is on the scale provided).
"
I don't mean to undermine or argue with you guys, I'm sure this is one of those things which are not ok in real life but are in the HSC just to simplify things.
Thanks again!
Jazz points out some problems with this assertion (as has Trebla above):
and offers an excellent piece of advice:I understand what your teacher is saying but that is not a good argument or reason in my opinion to draw a (0,0) data point. What your teacher is saying is not always true as not all solutions have 0 absorbance for 0 concentration. This is because if you are analysing something that is in the form of a mixture absorbance may occur not only from the species you are analysing but other components in the mixture. If you look at any of the HSC papers they never connect to the (0,0) point unless that data point has been provided.
If you want to extrapolate do it in dotted lines instead
MrGresh
Active Member
Thanks for the very detailed response! From all the students here we all really appreciate mods and past students pitching in to help.This is an interesting discussion, about which I would like to make a few points.
Though I am not generally into arguments from claimed expertise, I do want to preface this by saying:
As a general proposition, I agree with Jazz when he wrote:
- I have a first class Honours degree with a double major in Chemistry and a minor in Mathematics
- I also have a PhD in which I studied learning, developing understanding, and assessment in Chemistry
- I have tutored HSC and University Chemistry and Mathematics for more than two decades, have lectured Chemistry at University, and published research in Science Education
Within the bounds of the data points, drawing a line / curve of best fit is carrying out an interpolation. Extending beyond the bounds of the data is extrapolating. Extrapolation should only be done with care and due consideration for the validity of assumptions / justifications / that the trend should / will continue outside the range of the data. Interpolation should not be based on any data outside what was measured, so adding a (0, 0) point because you expect the trend should include the origin is bad technique. Similarly, extrapolation should not be done based on expectations of what the result should be, but only by following the established trend from the data. So, extrapolating to check whether an A v. c graph goes through the origin (as is expected) is reasonable, but forcing it through the origin and thereby altering the interpolation through the data is not appropriate, for the reasons that Trebla stated:
I want to add that there are situations where a considerable extrapolation is performed. One such experiment would be taking a fixed sample of gas and measuring its volume at different temperatures. The data might range over (say) 0 to 100 degrees Celsius. Plotting the V v. T (deg C) data should interpolate to a linear graph with a decent R2 value (and the equation of the regression line can be calculated fairly easily or obtained from software like Excel). Then, extrapolate all the way back to the intercept on the T axis. This corresponds to a theoretical volume of 0 and thus gives an estimate for absolute zero in degrees Celsius. I did this experiment when I was at school and the result was reasonable when considering the accuracy of measurements and the distance of the extrapolation. We were not asked to do the next step, but it is worth thinking about what the graph would look like if we could collect data for temperatures well below zero and particularly approaching absolute zero... the actual data would match the extrapolation and then cease to follow the trend - can you see why?
There was also a question in this year's HSC which deals with extrapolation and interpolation, on which I suspect many students will have made mistakes by not analysing the data in the proper way.
MrGresh, I have to agree strongly with Jazz that your teacher is simply wrong on this point. It is not reasonable to assume that there will be zero absorbance when there is zero concentration. It is reasonable to expect or anticipate that there will be zero absorbance at zero concentration. It is reasonable to extrapolate from the data to check whether zero absorbance corresponds to zero concentration. It is even reasonable to posit that there is an error if they do not correspond... but it is not ever reasonable to add an expectation as a point of data to a data set and then analyse as if the expectation was an empirical measurement.
Jazz points out some problems with this assertion (as has Trebla above):
and offers an excellent piece of advice:
I suppose maybe extrapolation in this case is "acceptable" in the scope of the HSC, but not so for further studies. But I agree that its likely that NESA would negate this issue by providing (0,0) as a point if they required a plot.
Anyways, thanks again (particularly to those who wrote the BOS trials this year) for helping!!
Now, MrGresh, you go to ask a question. It is very much not being a doofus - first, because it is always good to ask questions, and second, because you are right and have highlighted a point where Jazz has made a small error, and even his answer doesn't entirely address it (Sorry, Jazz):
Second, A v. c data for an AAS will not be linear if the concentration data are wrong. The calibration data will usually be collected from several samples prepared by serial dilution, but if the experimenter's technique is sloppy, the data will be noisy and the line of best fit could easily miss the origin.
Third, AAS stands for atomic absorption spectroscopy and it depends on the measurement being made on single atoms / ions that are unbound. This is achieved by aspirating (spraying) the sample into a flame where the solvent is vapourised and any species bound to the metal centre in question will be burned away. This is why the element is often complexed either to water or to a suitable organic ligand, so that the bare atom or ion will be quickly produced / released in the environment of the flame, by processes such as:
[Sr(H2O)6]2+(aq) -----in a flame-----> Sr2+(g) + 6 H2O(g)
[Sr(EDTA)]2-(aq) + a O2(g) -----in a flame-----> Sr2+(g) + x CO2O(g) + y H2O(g) + z NO(g)
EDTA4- is a ligand with formula [CH2N(CO2)2]24- that will burn away and release the strontium ion as an monatomic species.
Unfortunately, some materials that can be present in a sample may bind tightly to the metal centre and cause the measured absorbance to be suppressed. For example, trying to measure the concentration of calcium ions in the presence of phosphate is difficult. Even if Na4EDTA is added and so there is a competitive equilibrium between [Ca(EDTA)]2- and whatever calcium / phosphate species are present, the measured concentration of calcium will be an underestimate - and the extent of the underestimate will depend on the relative amounts of each species present, one reason being that it depends whether the sample Q reaches the value of the Ksp for Ca3(PO4)2.
Fourthly, looking at Q31 of the BoS paper, there does appear to be one line (the right-most on the Li emission spectra) that is at least very close to the wavelength of a line for Sr... so it would be wise to perform AAS using a Sr line that is not that line, to avoid the possibility of accidental interference from Li.
All of this comes back to the fact that you may get a non-linear A v. c graph for the calibration or inaccurate measurements for the unknown sample that are due to a technique problem or to an interference for which account has not been taken. More broadly, it is very poor science to add or subtract from an empirical data set without very good cause and suitable documentation / explanation. Interpolate with care. Extrapolate with great care. And avoid unreasonable / unjustified / unstated assumptions.
On the marking question, I agree with Trebla - there is nothing wrong with interpolating only and not extrapolating unless the circumstances direct you otherwise, either implicitly or explicitly).
In his answers, Jazz has done what I think many students will do and drawn a diagonal line through O that bends and becomes a horizontal line. I hope he'll agree (on reflection) that this is not the right thing to do.
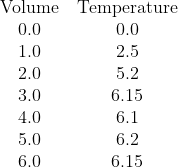
We have clearly two parts to the data. One part, with low volumes of citric acid, where the temperature change is increasing as citric acid is the limiting reagent, and a second part, for higher volumes, where citric acid is present in excess and thus the increase in temperature has stablised. Note that water was added to the citric acid solution so that each sample has the same total volume and mass of solution being heated so that the temperature change once the citric acid is present in excess is not being reduced by additional liquid to heat.
We seek the point where there is enough citric acid to consume all of the sodium hydroxide, but no excess.
The correct analysis is:
I might be being a doofus but doesnt the anwers in your paper contradict what you just said?
"The lamp in AAS contains the element to be analysed. In this case it contains strontium. The lamp therefore produces specific wavelengths of light that can only be absorbed by strontium ions in the sample. Therefore, other metals such as lithium do not interfere with the measurement that is obtained as they do not absorb light at these wavelengths." - Answer to Q31B
Sorry if I'm being an idiot or coming off as a twat
I don't agree that the "lamp therefore produces specific wavelengths of light that can only be absorbed by strontium ions in the sample." AES is used to identify (qualitatively) what elements are present in a sample, and can then be followed with an AAS analysis to quantify the amount present in an element-specific analysis, but it is subject to interferences. The point of using a lamp with the element to be analysed (strontium, in this case) is that the emissions from the lamp will be caused by transitions between energy levels of strontium, and so will exactly correspond to absorbance wavelengths of strontium. However, this does not mean that those specific wavelengths are unique to strontium. It is possible (though unlikely) to have another substance in the sample that happens to absorb precisely the same wavelength or even produce an emission at exactly that wavelength. In either case, the absorbance data can be effected. The collection of a blank measurement for subtraction is a good technique to avoid such problems, and as Jazz notes, some techniques like UV-Vis typically have a blank sample so that the instrument measures the difference between the samples and not the absolute absorbance of the sample being tested.It will mostly absorb due to the strontium however you need to understand that in real life it is not as simple as that because there can be other sources of error that lead to it not being 0. In real life you would actually take a blank measurement and then subtract that off everything and then make that the 0 point. This would especially be a problem for other techniques that are not as selective as AAS such as UV-Vis and colorimetry.
Second, A v. c data for an AAS will not be linear if the concentration data are wrong. The calibration data will usually be collected from several samples prepared by serial dilution, but if the experimenter's technique is sloppy, the data will be noisy and the line of best fit could easily miss the origin.
Third, AAS stands for atomic absorption spectroscopy and it depends on the measurement being made on single atoms / ions that are unbound. This is achieved by aspirating (spraying) the sample into a flame where the solvent is vapourised and any species bound to the metal centre in question will be burned away. This is why the element is often complexed either to water or to a suitable organic ligand, so that the bare atom or ion will be quickly produced / released in the environment of the flame, by processes such as:
[Sr(H2O)6]2+(aq) -----in a flame-----> Sr2+(g) + 6 H2O(g)
[Sr(EDTA)]2-(aq) + a O2(g) -----in a flame-----> Sr2+(g) + x CO2O(g) + y H2O(g) + z NO(g)
EDTA4- is a ligand with formula [CH2N(CO2)2]24- that will burn away and release the strontium ion as an monatomic species.
Unfortunately, some materials that can be present in a sample may bind tightly to the metal centre and cause the measured absorbance to be suppressed. For example, trying to measure the concentration of calcium ions in the presence of phosphate is difficult. Even if Na4EDTA is added and so there is a competitive equilibrium between [Ca(EDTA)]2- and whatever calcium / phosphate species are present, the measured concentration of calcium will be an underestimate - and the extent of the underestimate will depend on the relative amounts of each species present, one reason being that it depends whether the sample Q reaches the value of the Ksp for Ca3(PO4)2.
Fourthly, looking at Q31 of the BoS paper, there does appear to be one line (the right-most on the Li emission spectra) that is at least very close to the wavelength of a line for Sr... so it would be wise to perform AAS using a Sr line that is not that line, to avoid the possibility of accidental interference from Li.
All of this comes back to the fact that you may get a non-linear A v. c graph for the calibration or inaccurate measurements for the unknown sample that are due to a technique problem or to an interference for which account has not been taken. More broadly, it is very poor science to add or subtract from an empirical data set without very good cause and suitable documentation / explanation. Interpolate with care. Extrapolate with great care. And avoid unreasonable / unjustified / unstated assumptions.
On the marking question, I agree with Trebla - there is nothing wrong with interpolating only and not extrapolating unless the circumstances direct you otherwise, either implicitly or explicitly).
Now, looking at the 2020 HSC, Q25, I disagree with Jazz about how that graph should be drawn.I think it would be safe to assume that if you didn't extrapolate to the origin (unless the origin itself is a data point), you would not lose marks because the validity of the trend still holds (i.e. there is nothing wrong or incomplete about it). If you did lose marks, it would certainly be called out and questioned by many people.
Usually if extrapolation is required, the question would make that clear (see Physics 2019 paper). However, note that extrapolation does NOT necessarily imply extrapolation to the origin, especially if the line of best fit does not align that way (this is completely independent of what the theoretical model says).
As for if you did extrapolate without being asked to in the question, that's a bit unknown as to how lenient the HSC markers would treat that. However, note that the HSC in the past has asked questions where students were asked to point out the validity issues from extrapolation (though usually for non-zero values).
In his answers, Jazz has done what I think many students will do and drawn a diagonal line through O that bends and becomes a horizontal line. I hope he'll agree (on reflection) that this is not the right thing to do.
We have clearly two parts to the data. One part, with low volumes of citric acid, where the temperature change is increasing as citric acid is the limiting reagent, and a second part, for higher volumes, where citric acid is present in excess and thus the increase in temperature has stablised. Note that water was added to the citric acid solution so that each sample has the same total volume and mass of solution being heated so that the temperature change once the citric acid is present in excess is not being reduced by additional liquid to heat.
We seek the point where there is enough citric acid to consume all of the sodium hydroxide, but no excess.
The correct analysis is:
- Recognise that all the available data needs to be sub-divided into two data sets:
- Data set one (citric acid limiting) contains the volume data for 0.0 mL, 1.0 mL, and 2.0 mL
- Data set two (citric acid in excess) contains the data for 3.0 mL, 4.0 mL, 5.0 mL, and 6.0 mL
- Plot all the points
- Draw the interpolated (diagonal) line of best fit for data set one over the volume range of 0.0 to 2.0 mL (It should be roughly T = 2.567V)
- Draw the interpolated (likely horizontal) line of best fit for data set two over the volume range of 3.0 to 6.0 mL (It should be T = 6.15)
- Extrapolate the diagnoal line of best fit forward until 3.0 mL
- Extrapolate the horizontal line of best fit backwards until 2.0 mL
- The two dotted lines should meet. At the point of intersection, draw a vertical (dashed) line down to the Volume (x) axis. This position is the volume of citric acid that you seek, where the citric acid and sodium hydroxide are present in their stoichiometric ratio and neither is in excess. It is very close to V = 2.4 mL. Stating this value should be the start of your calculations, which should get [NaOH] = 0.96 mol L-1