-
Looking for HSC notes and resources? Check out our Notes & Resources page
Make a Difference – Donate to Bored of Studies!
Students helping students, join us in improving Bored of Studies by donating and supporting future students!

Functions (1 Viewer)
- Thread starter kazemagic
- Start date
iBibah
Well-Known Member
- Joined
- Jun 13, 2012
- Messages
- 1,368
- Gender
- Male
- HSC
- 2013
Plot some points and you with see what it looks like, it's actually really simple when you think about it.
For question 12 (v)
How do you find the domain and range for that graph? I don't even know how to draw that type of absolute value graph lol
Any help would be appreciated
Thanks
Sy123
This too shall pass
- Joined
- Nov 6, 2011
- Messages
- 3,724
- Gender
- Male
- HSC
- 2013
Domain: All x 
How do I know this?
-> The Absolute Value function does not restrict what X values I can put in, it only restricts what Y values come out.
Think back to the very basics of functions, functions are not 'graphs' graphs are merely visual representations of functions.
A function is somethng where if you input 1 value you get ONE value.
Multiple inputs can have 1 output though. This might sound confusing but it is important to understand the concept.
So let us look at the Absolute Value function, does it restrict our input? No.
Is there a functin that does restrict input? Yes.
Look at for instance.
We are restricted to only non-negative inputs.
We know x=/=0 since we can't divive by zero, and we know that our input into f(x) is not restricted, hence we get
All real x, x=/=0
Range:
y=1, y=-1
This seems strange, have a range only applicable for two values, unlike what we normally have as infinite values. (i.e. -1 < y < 1)
But that's fine, f(x) can only ever be 1, or -1. Why?
Because of the definition of |x|
If you remember:
So lets put this definition into action.
So for x > 0
f(x) = x / x = 1
for x < 0
f(x)= x / -x = -1
Hence we can only ever get two outputs, therefore the range is y=-1, y=1
How do I know this?
-> The Absolute Value function does not restrict what X values I can put in, it only restricts what Y values come out.
Think back to the very basics of functions, functions are not 'graphs' graphs are merely visual representations of functions.
A function is somethng where if you input 1 value you get ONE value.
Multiple inputs can have 1 output though. This might sound confusing but it is important to understand the concept.
So let us look at the Absolute Value function, does it restrict our input? No.
Is there a functin that does restrict input? Yes.
Look at
We are restricted to only non-negative inputs.
We know x=/=0 since we can't divive by zero, and we know that our input into f(x) is not restricted, hence we get
All real x, x=/=0
Range:
y=1, y=-1
This seems strange, have a range only applicable for two values, unlike what we normally have as infinite values. (i.e. -1 < y < 1)
But that's fine, f(x) can only ever be 1, or -1. Why?
Because of the definition of |x|
If you remember:
So lets put this definition into action.
So for x > 0
f(x) = x / x = 1
for x < 0
f(x)= x / -x = -1
Hence we can only ever get two outputs, therefore the range is y=-1, y=1
ohhh lol thx i never thought about plotting pointsPlot some points and you with see what it looks like, it's actually really simple when you think about it.
now i get it ThanksDomain: All x
How do I know this?
-> The Absolute Value function does not restrict what X values I can put in, it only restricts what Y values come out.
Think back to the very basics of functions, functions are not 'graphs' graphs are merely visual representations of functions.
A function is somethng where if you input 1 value you get ONE value.
Multiple inputs can have 1 output though. This might sound confusing but it is important to understand the concept.
So let us look at the Absolute Value function, does it restrict our input? No.
Is there a functin that does restrict input? Yes.
Look at
We are restricted to only non-negative inputs.
We know x=/=0 since we can't divive by zero, and we know that our input into f(x) is not restricted, hence we get
All real x, x=/=0
Range:
y=1, y=-1
This seems strange, have a range only applicable for two values, unlike what we normally have as infinite values. (i.e. -1 < y < 1)
But that's fine, f(x) can only ever be 1, or -1. Why?
Because of the definition of |x|
If you remember:
So lets put this definition into action.
So for x > 0
f(x) = x / x = 1
for x < 0
f(x)= x / -x = -1
Hence we can only ever get two outputs, therefore the range is y=-1, y=1
your posts was really helpful lol thx for redefining functions 4 me nifkeh
Member
- Joined
- May 29, 2012
- Messages
- 383
- Gender
- Female
- HSC
- 2013
domain: all real x, x not equal to 0
range: all real y, y not equal to 0 EDIT: I'm wrong lol, sy is correct for this
that's what I think it is, I could be wrong, basically you just sub in x values for domain that are possible and not like imaginary numbers
for range you just get the range of y values possible from the possible or real x values
I dunno how to draw this graph but I would plot a table of values lol and then draw out the graph? dunno if this is the right way
You can certainly draw a table of values to get a picture of what the graph looks like. However, it is not the most efficient way of doing it.domain: all real x, x not equal to 0
range: all real y, y not equal to 0 EDIT: I'm wrong lol, sy is correct for this
that's what I think it is, I could be wrong, basically you just sub in x values for domain that are possible and not like imaginary numbers
for range you just get the range of y values possible from the possible or real x values
I dunno how to draw this graph but I would plot a table of values lol and then draw out the graph? dunno if this is the right way
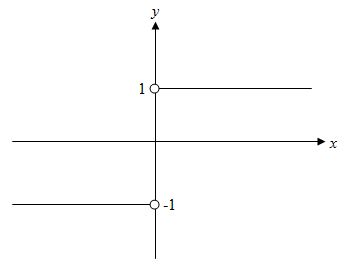
The best way is to recall the 'formal' definition of the absolute value and take care of the conditions as Sy has pointed out. If you do this, you get y=1 for x>0 and y= -1 for x<0.
As show below:
Last edited:
domain: all real x, x not equal to 0
range: all real y, y not equal to 0 EDIT: I'm wrong lol, sy is correct for this
that's what I think it is, I could be wrong, basically you just sub in x values for domain that are possible and not like imaginary numbers
for range you just get the range of y values possible from the possible or real x values
I dunno how to draw this graph but I would plot a table of values lol and then draw out the graph? dunno if this is the right way
Yea thanks guiseYou can certainly draw a table of values to get a picture of what the graph looks like. However, it is not the most efficient way of doing it.
The best way is to recall the 'formal' definition of the absolute value and take care of the conditions as Sy has pointed out. If you do this, you get y=1 for x>0 and y= -1 for x<0.
As show below:
appreciate itGot another question lol:

I dont even know what question 4 is asking?
Thanks
Sy123
This too shall pass
- Joined
- Nov 6, 2011
- Messages
- 3,724
- Gender
- Male
- HSC
- 2013
Just find g(x) (which we can since we are given two points)Yea thanks guise
Got another question lol:
I dont even know what question 4 is asking?
Thanks
Then state range
Consider some linear functions e.g. y=2x+5 , y=5x+1, y=6x.
Notice that all linear functions can be written in slope intercept form i.e. y=mx+b. However for these questions I have a strange tendency to say linear functions are in the form y=ax+b. So i write 'a' instead of 'm'....not that it matters.
So you need to develop a pair of equations using g(3)=2 and g(4)=4. So begin like this:
Linear equations are of the form g(x)=ax+b.
When x=3, g(3)=2 so:
2=3a+b --------(1)
When x=4, g(4)=4 so:
4=4a+b --------(2)
Solve these two equations simultaneously to find 'a' and 'b'. Sub them back into g(x)=ax+b and that is your answer.
Just find g(x) (which we can since we are given two points)
Then state range
ahh okai thanks guiseConsider some linear functions e.g. y=2x+5 , y=5x+1, y=6x.
Notice that all linear functions can be written in slope intercept form i.e. y=mx+b. However for these questions I have a strange tendency to say linear functions are in the form y=ax+b. So i write 'a' instead of 'm'....not that it matters.
So you need to develop a pair of equations using g(3)=2 and g(4)=4. So begin like this:
Linear equations are of the form g(x)=ax+b.
When x=3, g(3)=2 so:
2=3a+b --------(1)
When x=4, g(4)=4 so:
4=4a+b --------(2)
Solve these two equations simultaneously to find 'a' and 'b'. Sub them back into g(x)=ax+b and that is your answer.