
nightweaver066
Well-Known Member
- Joined
- Jul 7, 2010
- Messages
- 1,585
- Gender
- Male
- HSC
- 2012
Question:
A student measured the magnetic flux through a solenoid of 100 turns and entered data into a spreadsheet. Her data is graphed below:

A good description of the potential difference generated in the solenoid would be:
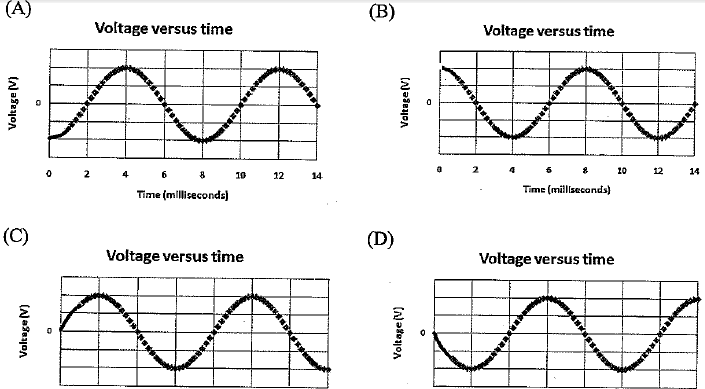
What i thought it was: A
What the answer is: D
I thought it was A because there's the greatest change in flux (greatest gradient) and so greatest EMF would be induced at that point, which would be negative at first to oppose the change in flux.
Can anyone explain to me why i'm wrong and why the answer is D?
Thanks
A student measured the magnetic flux through a solenoid of 100 turns and entered data into a spreadsheet. Her data is graphed below:
A good description of the potential difference generated in the solenoid would be:
What i thought it was: A
What the answer is: D
I thought it was A because there's the greatest change in flux (greatest gradient) and so greatest EMF would be induced at that point, which would be negative at first to oppose the change in flux.
Can anyone explain to me why i'm wrong and why the answer is D?
Thanks
