The bottom graph tracks an individual’s (Sally-Anne’s) serum creatinine level, creatinine clearance and estimated glomerular filtration rate over 8 days.
Her serum/blood creatinine level (blue triangle data points) is progressively linearly increasing which indicates that her kidneys are not clearing creatinine (green squares), a constant by-product of muscle metabolism to store and utilise energy, reflecting the declining ability of her kidneys to filter creatinine and other substances circulating in her blood (purple diamonds).
The decline in her kidney function is happening quite rapidly, so her nephrologist (kidney specialist), needs to treat her immediately to try and reverse whatever disease process is going on and hopefully preserve as much kidney function as possible.
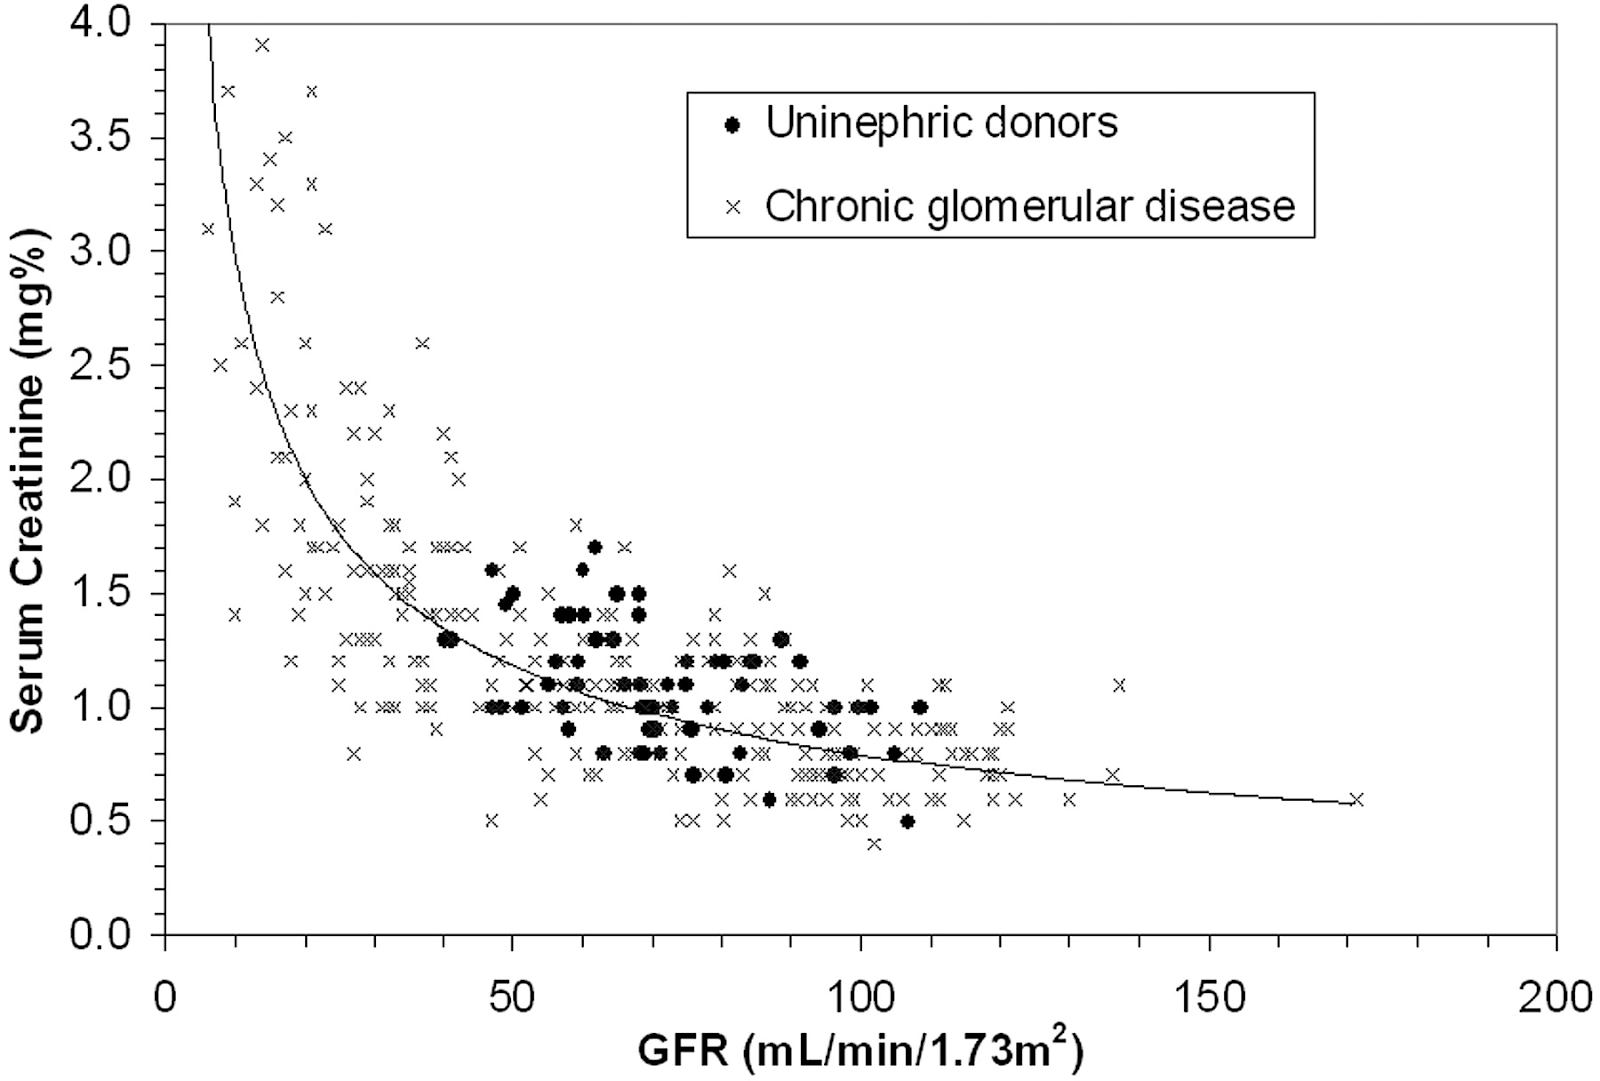
The top graph shows the general relationship between creatinine and glomerular filtration rate which is an inverse exponential graph.
It shows that a filtration rate > 90mL/min/m^2 maintains a normal creatinine level of < 1.0 mg%.
As filtration rate decreases, serum/blood creatinine starts to accumulate but down to about 50 mL/min/m^2, kidneys are reasonably able to filter out creatinine to maintain relatively stable blood levels of <1.8 mg%, with the graph showing that most people who donate a kidney are stable within that range.
Once filtration rate gets below 50 mL/min/m^2, the kidneys aren’t clearing creatinine sufficiently and so it rapidly accumulates.
Creatinine itself is not a particularly toxic substance, but its level & clearance, from which GFR can be inferred, indicate similar loss of kidney function in filtering out other water soluble waste products (many of which are toxic), so without urgent treatment, Sally-Anne will rapidly become very sick.