Hey everyone!
Can somebody please teach me how to draw trigonometric graphs in terms of pi and its features (eg. what happens to the amplitude and period when you multiply the function like (2cosx, 3sinx, 4tanx etc) or add it with an integer (eg. cox+3) etc).
My teacher didn't really cover this in the preliminary course when we did trigonometry and I can't do questions on trigonometric functions atm because I don't know what to draw.
Thanks!
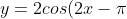
- If I have
) , A determines the amplitude of the curve. This is how high it goes up and down. The larger A is, the higher it goes up and down.
, A determines the amplitude of the curve. This is how high it goes up and down. The larger A is, the higher it goes up and down.
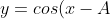
- If I have
+A) , A determines how much I shift the original cos curve up and down. If
, A determines how much I shift the original cos curve up and down. If  , then the entire curve
) is shifted up by 1 unit.
is shifted up by 1 unit.
- If I have
) , A determines how 'fat' or 'skinny' my curve is. If A is larger, then the curve is skinner. If A is smaller, then the curve is fatter. If
, A determines how 'fat' or 'skinny' my curve is. If A is larger, then the curve is skinner. If A is smaller, then the curve is fatter. If  , then the curve is twice as skinny. If
  , then the curve is twice as fat.
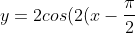
- If I have
) , A determines how much I shift the original curve sideways. If
, A determines how much I shift the original curve sideways. If  , then the curve is shifted to the right by
  units.
What I listed above is all you need to know. Combine all of these transformations to break down a big question.
For example, if I was asked to draw the curve
-2\pi)
, then this is what I would do (if I'm still learning. Eventually, you will learn to do it in 1 go):
1. Change the question to make it become
)-2\pi)
This is because you want to make the coefficient of X become 1. Transformations are easier to spot this way.
2. Draw the original cos curve, but with amplitude 2 instead of 1.
3. Shift it to the right by

units, since the inside of the bracket is

.
4. Shift down by

units.
5. Squash my curve to make it twice as skinny (so within the same interval, it should have double the number of periods)
6. Enjoy new curve.
The key do getting these questions right is to do
1 transformation at a time. Many students try to combine several transformations at once, and end up screwing up the question. Although this method takes up a bit more time, it guarantees that you will get full marks.
Eventually, you will be able to skip steps once you master these techniques.
